
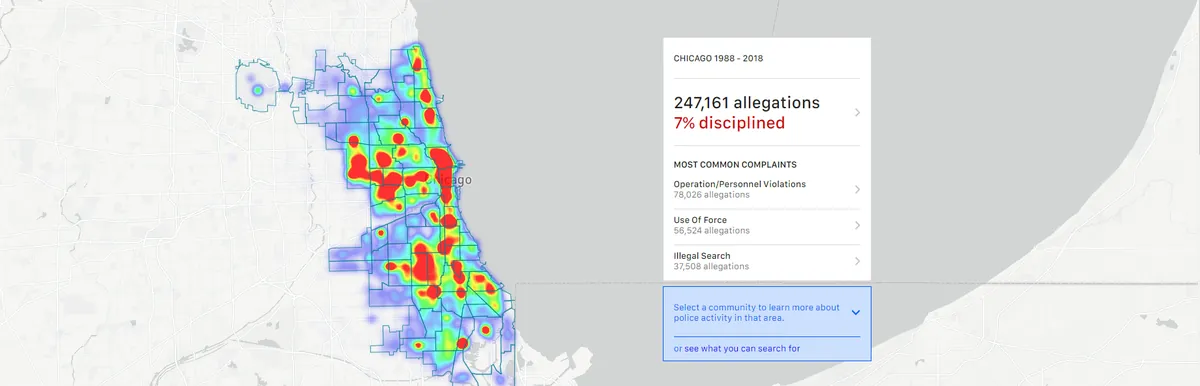
01WhatDoes income shape policing?
With my team, The Dapper Squirrels, I worked on the Citizens' Police Data Project database. Our theme was misconduct by location and community: is there over-policing in low socio-economic neighborhoods, and could a neighborhood's income influence the “victim” narrative in complaint reports?
02QuestionsWhere we started.
- Which neighborhoods have the highest and lowest incomes?
- What are each neighborhood's income and complaint records per capita?
- How many tactical response reports per capita?
- What is the racial makeup of each community?
- Which streets have the most allegations in each beat?
03HowFive checkpoints.
- SQL — the relational questions above.
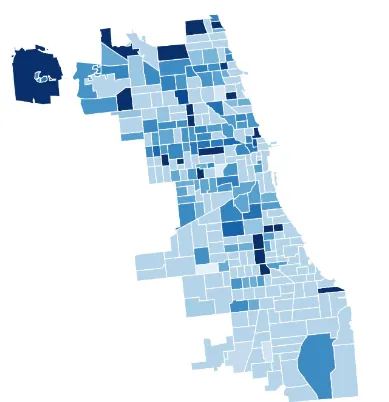
- Visualization — officer hours per capita over the years, and complaints versus tactical responses per capita.
- Interactive visualization — high- and low-income communities on a map, with a time slider.
- Graph analytics — co-accusal networks of officers, with triangle counts and PageRank to find the most connected officers.
- NLP — topic modeling of complaint text, from TF-IDF towards graph neural networks and BERT.
Adapted from my original write-up · more in the links above.